Octotally is a free, small business accounting software and finance management tool for small business owners. It works like a finance manager. It helps to understand the day-to-day transaction data.
You can add directly on the “Data Entry” tab. Simply fill up the date, description, amount, currency (INR or USD), type {Income, Expense, Asset, Liability, Equity}, and category. You can see all transactions below down.
Yes, the tool supports two currency Indian Rupees (INR) and US Dollars (USD) for individual transaction entries. For all financial reports, all amounts are automatically converted to US Dollars (USD) using a static conversion rate (currently 1 USD = 83.00 INR for demonstration purposes).
Yes, you can “upload” this tool, which provides functionality to import data from Excel or CSV files. In the upload section, you can see all the templates’ requirements.
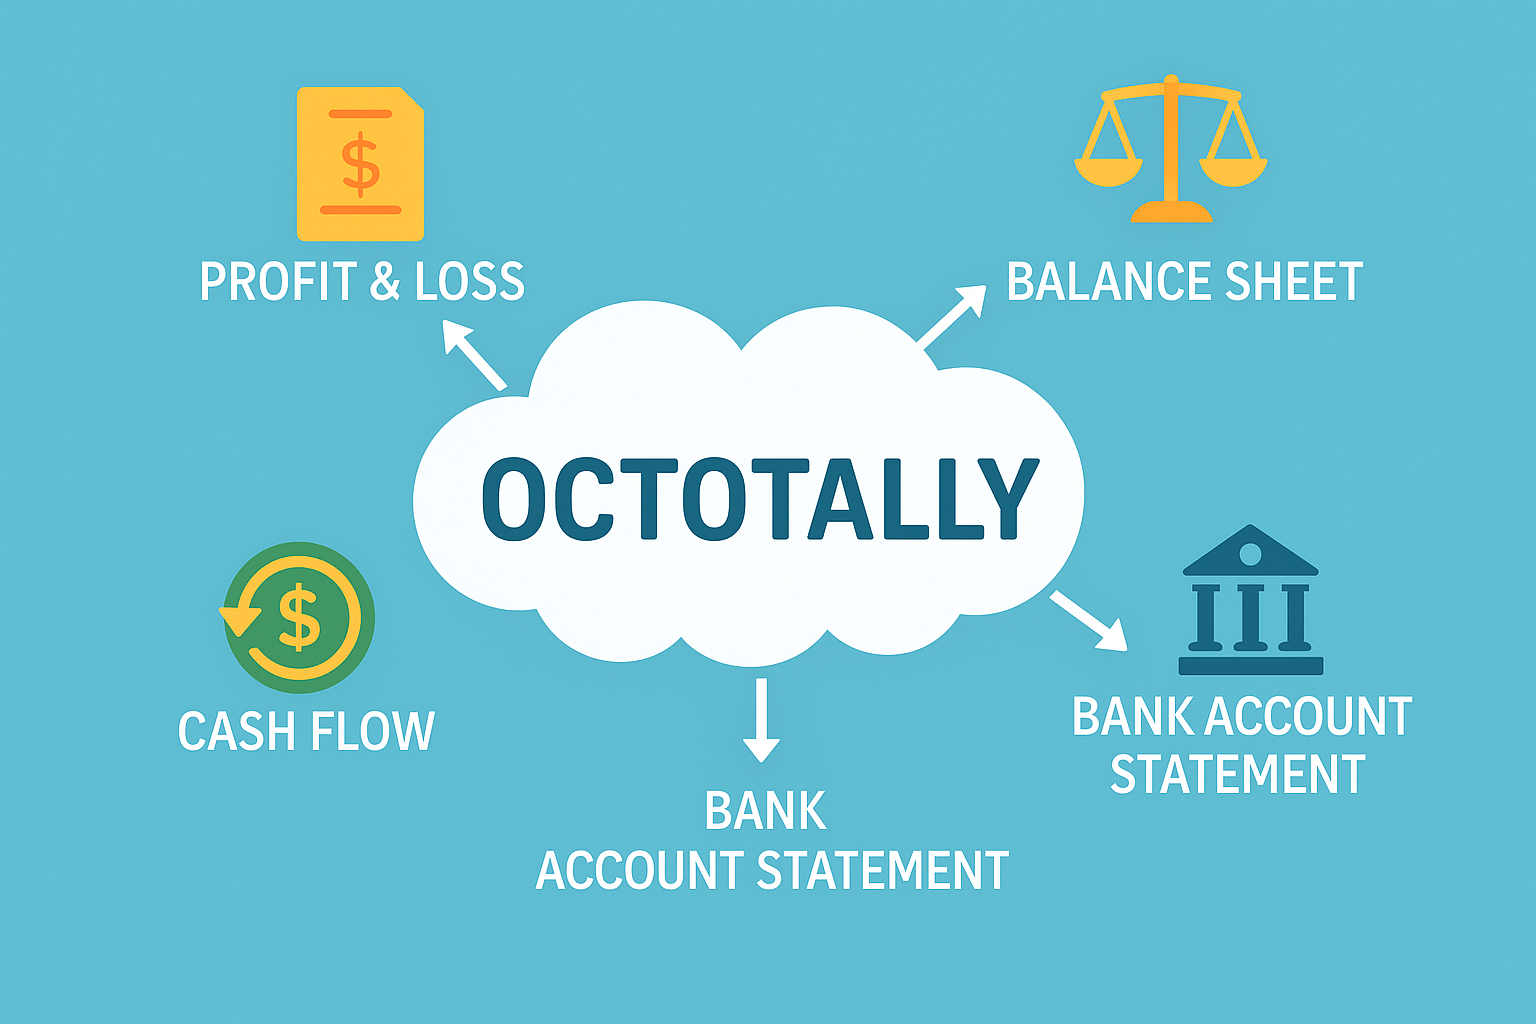
The “Reports” tab allows you to generate several key financial statements:
Profit & Loss Statement
Balance Sheet
Cash Flow Statement
Bank Account Statements
Ledger Statements
In this current version, your financial data (transactions) is locally within your browser’s session. This means that if you close your browser/website and clear your browser’s data, the transactions or data will be lost. This is for regularly using the “Export to CSV” or “Copy to Clipboard” options available in the reports section to save your data externally. “Export to PDF” is not available in the current version.
On the “Data Entry” tab, there is a “Clear All Transactions” button. Clicking this will prompt a confirmation modal. If you confirm, all your entered and uploaded transaction data will be permanently deleted from the application, and you can delete one by one, but if you delete then, it cannot be undo.
The “Help” button opens a modal that provides definitions for key financial terms (Income, Expenses, Assets, Liabilities, Equity) and detailed explanations for each of the pre-defined transaction categories. This is useful for understanding how to categorize your transactions correctly. Basically, the help section is for those who have zero knowledge of financial accounting.
The “Dashboard” tab provides a quick overview of your financial health. It displays key performance indicators (KPIs) such as Total Revenue, Total Expenses, Net Profit/Loss, Total Transactions, Average Transaction Value, Outstanding Receivables, Outstanding Payables, Total Assets, and Total Liabilities. It also includes visual charts for Monthly Revenue Trend, Income Distribution by Category, Top Expense Categories, and Expense Distribution by Category, along with a list of your most recent transactions. Its help user to understand easily with zero financial account.
Yes, The application is designed with responsiveness and UI & UX friendly. It ensure that the layout, forms, tables, and charts adapt well to various screen sizes, from mobile phones to tablets and desktops, providing an optimal user experience across different devices.


 .
.